What is G.R.E.A.T.?
G.R.E.A.T. contains statewide databases for all counties, municipalities, and towns from 1987-2020 (the most current data available). This tool automatically maps out revenue and expenditure information in easy-to-use graphs.
The information provided in these graphs is not intended to indicate a course of action but to provide a basis for discussion. The real value is in providing educational information on various elements of public finance for local officials and citizens, to start discussion and examination of local budgets and financial management, services provided, and how they are financed. Local officials will find this visualization of revenues and expenditures informative and perhaps even eye-opening.
How GREAT Has Been Used
Local government officials, UW-Extension county educators, UW-Oshkosh graduate students, academics, and others have used the GREAT software in their work.
GREAT’s Data Sources
The Wisconsin Department of Revenue annually compiles local revenue and expenditure data going back to 1987 from statutorily-mandated financial reports. The summary data is published in an annual report titled, “County and Municipal Revenues and Expenditures.”
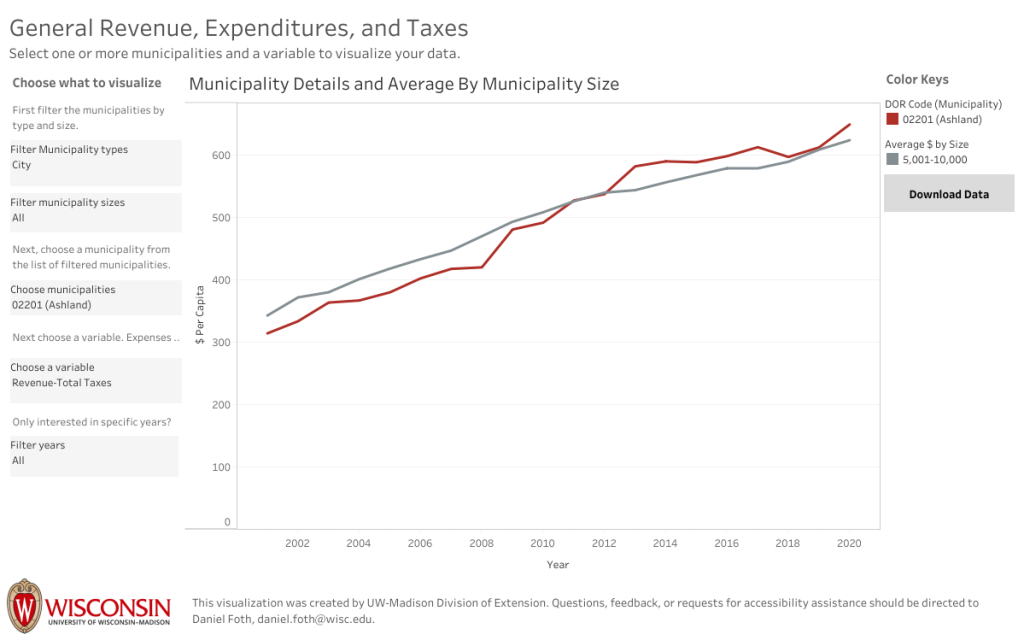
Each revenue and expenditure category is expressed in terms of dollars spent per person (“per capita”). In other words, each revenue or expenditure total is divided by the county, municipality or town population. The profiles compare the individual county, municipality or town to other Wisconsin places of similar populations.
Four primary sources of revenue, plus total general revenue are explored for municipalities. The category, “other taxes,” is included for counties to account for sales tax collections.
- General Property Tax
- Shared Revenues
- Total Intergovernmental Revenues
- Public Charges for Services
- Total General Revenues
- Other Taxes
Nine primary categories of expenditure are explored for municipalities and ten are presented for counties:
- General Government
- Law Enforcement
- Fire Protection
- Solid Waste Collection and Disposal
- Debt Service
- Highway Maintenance
- Cultural and Educational
- Parks and Recreation
- Total Expenditures
- Health and Human Services
Sample Graphs
The sample graphs below are available for your local government with just a few mouse clicks.
Additional Resources
An additional database and mapping ability are available through the University of Wisconsin-Madison’s Applied Population Lab at http://www.getfacts.wisc.edu/mapping.php. Instructions on using this tool are available here.
Contacts for GREAT
If you have any questions, please contact lgc@extension.wisc.edu